





Store, GA4 and ads. Finally side by side. Automated e-commerce analytics

DataOrganizer is a browser-based app that has been automatically combining e-commerce data for years: your store, marketplaces, GA4 and ads in one consistent view, with ready-made dashboards, recommendations, reports and AI analysis.

Set it up yourself in 14 minutes, no plugins needed. From €24 per connection.

14-day free trial No code, no IT Unlimited users
Store + Marketplace
orders · margin · returns
GA4
sessions · funnel · sources
Google · Meta · TikTok
spend · CPC · conversions
Real ROAS6.8+0.5
Profit after costs€31,240+11.2%
DataOrganizer 6 sources · 04:12
Sales
€96,240
Ad spend
€8,420
Sessions (GA4)
52,380
Real ROAS by channel · store sales
Google Ads
7.8
Meta Ads
5.9
TikTok Ads
2.4
Purchase funnel · last 7 days
Sessions
52,380
Product views
28,460
Add to cart
6,240
Checkouts started
2,180
Transactions
1,640
Customer segments · revenue share
New customers · 25%
€24,180 −1.8%
Returning · 75%
€72,060 +24.6%
Order statuses in dashboards
completed
1,412
processing
236
failed
12
cancelled
9
19
data sources via official APIs
14 min
to your first report
€24
per connection a month, team included
0
plugins, code changes or training
Brands running on connected data
4komJohn DogOneDayMoreCDRLCoccodrilloSensum Mare
The problem

Five dashboards.Five versions of the truth.

Every platform counts conversions its own way and claims the sale for itself: Meta takes credit for Google’s transactions, GA4 can’t see your margin, and the totals across dashboards add up to three times your real sales. Same week, five answers:

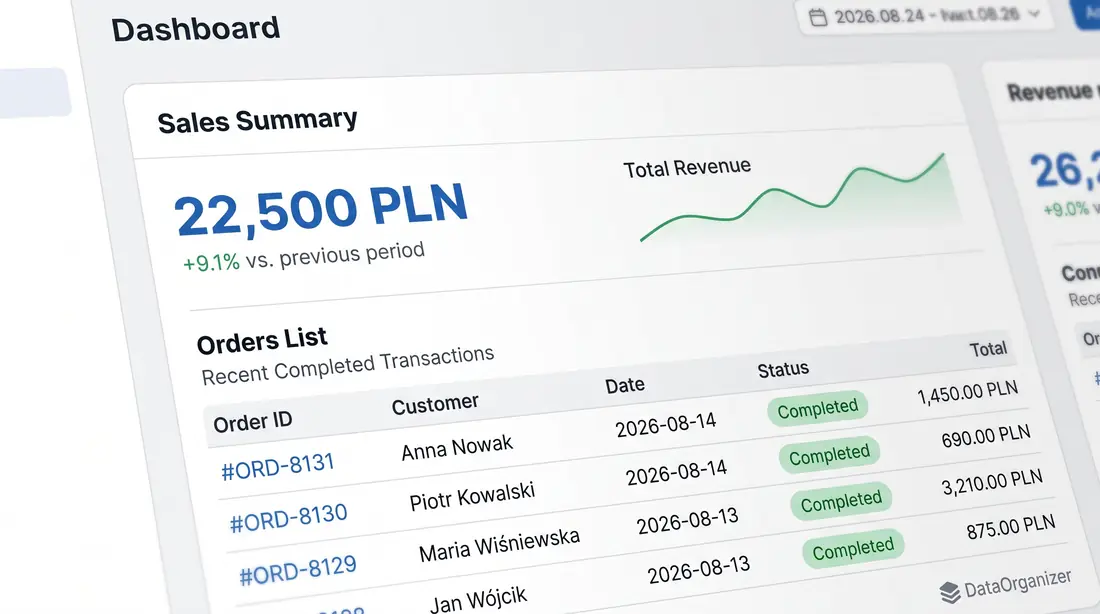
Store dashboard: €22,500Store dashboard€22,500
Google Ads: €14,900Google Ads€14,900
Meta Ads: €11,500Meta Ads€11,500
GA4: €16,100GA4€16,100
Marketplace: €4,200Marketplace€4,200
Once your sources are connected
€22,500

That’s what the store really sold, after cancelled orders and returns, which ad platforms don’t account for at all. DataOrganizer measures every channel against your full store data, so conversions are deduplicated and no sale is ever counted twice.

5 dashboards to check every morning Meta and Google claim the same sale Returns and cancellations invisible in ad platforms 12 hours a week lost in spreadsheets
How it works

One data hub.Everything orbits around it.

Connect each source once. From then on, your data is pulled, joined and recalculated daily. Ask the AI Assistant anything, or use your own AI via MCP.

Step 01

Connect via API

Your store and marketplace accounts with an API key, Google and Meta with a quick sign-in. No plugins, no code changes, no IT.

~14 minutes, once
Step 02

The automation joins your data

It matches orders, sessions and ad spend by product, campaign and day, unifies names and converts currencies.

every night, on its own
Step 03

Ask and export

Ready-made dashboards, an AI chat in plain English, MCP for Claude, ChatGPT and other AI tools, exports to Sheets and CSV. Unlimited users.

every day, the whole team
Connected views

Reports no ad platformwill ever show you.

Only connected data shows how ads, traffic, margin and channels really add up.

Ad performance · real ROAS · store sales
SourceBudget shareROASSales
Google
7.8214
Meta
5.9168
TikToklowest return
2.436
Meta reported 9.2. Store orders show 5.9.

Ads vs real sales

ROAS calculated on store orders, the same way for every platform, with no sale credited twice.
Funnel · GA4 + store orders · 7 days
1Sessions52,380100%
2Product views28,46054.3%
3Add to cart6,24011.9%
4Checkouts started2,1804.2%
5Transactions (store)1,6403.1%
Biggest drop: cart → checkout (−65%), since Tuesday.

Traffic vs orders

GA4 sessions and funnel next to real purchases. See where the traffic is but the sales aren’t, and when it started.

Product margin · after all costs
ProductRevenueCostMargin %
Vit. C serum 30 ml€18,320€6,410+52.4% ↗
SPF 50 cream€12,940€5,830+43.1% ↗
Argan oil€9,480€5,690+18.7% ↗
Gift set€7,210€5,950+9.2% →

Turnover vs margin

Purchase cost, shipping and returns next to every product. A bestseller that makes no profit can’t hide behind its sales.

Channel comparison · last 30 days
Online store
€14,850 +12.5%
commission: €0 · shipping 2.1%
Marketplace
€11,480 +8.4%
commission + fees: −€1,940
Vit. C serum: 52.4% margin in the store, 38.9% on the marketplace.

Store vs Marketplace

The same product in two channels, commission included. Find out where it actually pays to sell.

Campaigns × products · margin
CampaignProductUnitsRevenueMargin
Summer Glow · MetaVit. C serum250€18,750+42.1%
Always SPF · GoogleSPF 50 cream110€14,850+45.8%
Bestsellers · TikTokArgan oil420€11,500+30.5%

Campaigns vs products

Which products each campaign actually sold, and at what margin. Ads and your product range in one table.

Compare date ranges
20 to 26 Aug 2026 (7 days) vs:
Previous period · 13 to 19 Aug
Last year · 20 to 26 Aug 2025
Net sales
€4,850
+12.5%
Real ROAS
4.2
+18.6%
Sessions
1,450
+21.5%

Today vs any period

All sources on the same dates and time zone. Compare weeks and years without lining anything up by hand.

Features

Built to answer.Not just to show.

Everything below is included. You only pay for the number of connected sources.

Real ROAS · all channels · 7 days
Real ROAS
6.8
+0.5
Meta ROAS · inflated
9.2
double-counted
Real ROAS by channel
Google
7.8214
Meta
5.9168
TikTok
2.436
20 Augsales from ads · daily26 Aug
Real ROAS

ROAS calculated on store sales, not inside the ad platform

Meta reported 9.2, but store orders came out at 5.9. Every platform is measured the same way, and no sale is credited twice.

AI Assistant

Ask in plain English. It answers with your own numbers.

Purchase funnel · GA4 + store · 7 days
52.4k
28.5k
6.2k
2.2k
1.6k
SessionsProductCartCheckoutPurchase
Purchase funnel

See exactly where conversions leak

Sessions → cart → checkout → purchase. Day by day, with promotions and changes in context.

Summary · revenue vs costs · 7 days
Net revenue
€96,240
+20.4%
Net profit
€87,820
+22.9%
Net revenueCosts
9 dashboards

Ready from day one

Summary, products with margin, customers, marketing, traffic, market. Zero setup.

MCP Server

Your data in the AI chat you already use

Connect DataOrganizer via MCP and ask about your store right where you work.

Claude ChatGPT Codex Gemini Perplexity Sheets
Share of revenue · 128 products
30% of products
80% of revenue
70% of products
20% of revenue
12 products bring in half of your revenue. Ask the AI about the rest of the catalogue.
Insights

30% of products drive 80% of revenue

Pareto, margin vs turnover, words in product names, items bought together. The places nobody thinks to look, one question away.

slide 2/6 · .pptx
Weekly results · 20 to 26 Aug
Sales are growing, but not everywhere
Revenue
€96,240 +20%
Real ROAS
6.8 +0.5
Download .pptx Google Slides Data sheet
Reports and slides

Not just an answer, a finished presentation

A weekly report, a .pptx for the board, a data sheet. Say what you need and you get the file.

Sources

19 integrations.One click each.

Official APIs, no plugins and no changes to your store’s code. Refreshed every day.

WoWooCommerce ShShopify IdIdoSell SpShoper PrPrestaShop MgMagento SkSky-Shop RcRedCart MpMarketplace MCMerchant Center
GAGoogle Ads MeMeta Ads TtTikTok Ads CrCriteo TrTradeTracker MsMicrosoft Ads PiPinterest Ads G4Google Analytics 4 SCSearch Console

Don’t see your platform? Drop us a line and we’ll check its API and add it to the list.

Included

Once your data is connected,the rest is included.

You pay for sources. Everything that runs on them comes at no extra cost.

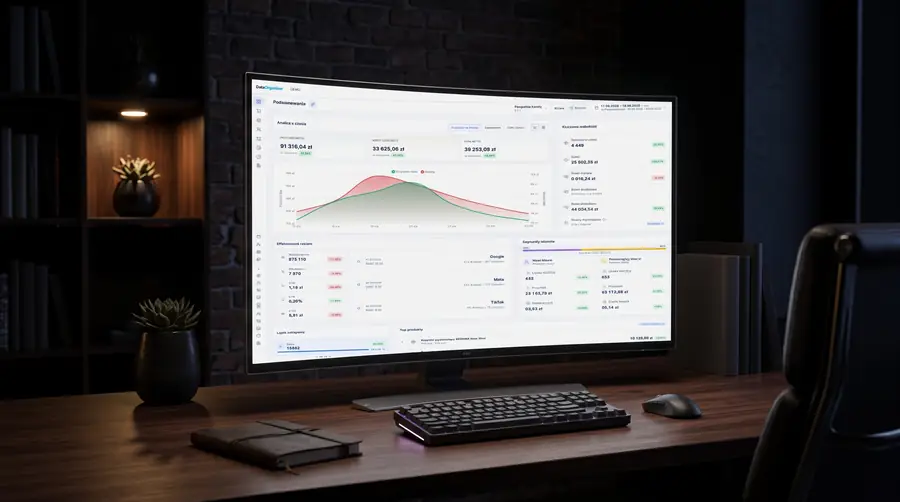
Ready-made e-commerce dashboards on a monitor

9 ready-made dashboards

Summary, orders, products, customers, marketing, site traffic, market and competition, product attributes and an analysis library. Filled with data from day one, with date filters and export.

Chat with the AI Assistant on screen

An AI Assistant on your data

Ask in plain English and get a number, a table or a ready-made file, because it works on your connected data, not on the open web.

Data exported to spreadsheets on two screens

Exports and MCP

Google Sheets, CSV and MCP for Claude, ChatGPT and Gemini. Your connected data works in your own tools too.

Pricing

Pricing that fits on a receipt.

You only pay for the number of connected sources. Features, users and the AI Assistant are included. Volume discounts apply automatically.

Work out your price no surprises
72 € / monthfor 3 connections €24 each full price
3
1102030
First 4€24 each 5th to 14th€20 each · −17% 15th and up€17 each · −29%
9 e-commerce dashboards AI Assistant on your data Unlimited users Sheets, CSV, MCP and Looker 30,000 AI credits / month Dedicated support to help you get connected
Create free account 14 days, no commitment · no credit card · cancel in 1 click

An agency with several client stores? Business+ with custom pricing.

Who it’s for

Everyone looksat the same numbers.

No SQL, no training, no seat limits. One source of truth for everyone working on the store. We’ve been building DataOrganizer for years, helping e-commerce businesses understand their data and get more out of their analytics.

Store owner with morning coffee and the DataOrganizer dashboard

Store owner

Five minutes over your morning coffee: what you earned, what sells profitably and whether your ads are paying off.

E-commerce manager at work

E-commerce manager

Your weekly report from one view, instead of an evening spent piecing together exports from five platforms.

Performance agency team

Performance agency

Every client reported the same way. Real ROAS and margin without chasing anyone for exports.

Data analyst working with charts

Analyst

A clean, connected dataset instead of building your own ETL. Sheets, CSV and MCP for your own models.

FAQ

Before you ask

Do I need to install anything in my store?

No. Connections run through official APIs: you enter a key or sign in to the source and approve access. No plugin and no changes to your store’s code.

How do you combine data from different sources?

The automation matches data by product, campaign and day: it joins store orders with GA4 sessions and ad platform spend, unifies names and converts currencies. It does this every day, with no input from you.

How is this different from Looker Studio?

Looker draws charts from data that someone has to connect and maintain first. DataOrganizer does that part for you: it joins your sources, calculates margin and real ROAS, and only then builds the reports. If you like Looker, you can keep using it on top of our data.

How much does it really cost?

€24 a month per connection, and that’s the whole price. A typical store (platform + GA4 + Google Ads + Meta) pays €96 a month. Users, dashboards, exports and the AI Assistant are all included, with no plans to choose from and no add-ons.

Who is behind it?

DataOrganizer is built by the Datadiary team. We’ve spent years helping e-commerce businesses understand their data and get more out of their analytics, and the tool runs on real data from stores and agencies every day.

Is my data safe?

Every store gets its own isolated database on Google Cloud (ISO 27001, SOC 2), with TLS 1.3 and AES-256 encryption. We process business metrics, not your customers’ personal data, and we never train AI models on it.

What if I cancel?

Cancelling takes one click and there’s no notice period. You can export your data to CSV or Google Sheets first, and you can add or remove sources at any time.

The whole picturein 14 minutes.

A minute to create your account, a few more to connect your sources, and the automation does the rest. No card, no sales call, no commitment.

No credit card Cancel in 1 click Dedicated support included