November and December are when stock for the first quarter is ordered and the marketing budget for the whole year is approved. The forecast all of this rests on usually fits in a single spreadsheet cell: “plus 15%”, typed in on instinct and split evenly across twelve months. This guide shows how to forecast sales in an online shop from your own order history in three steps, how to check the forecast against last year and how to turn it into three scenarios for the purchasing plan and the budget.
The example used throughout: a shop selling office supplies to businesses, with €1,200,000 of order revenue in the last 12 full months. A spreadsheet and the data the shop already has are enough to calculate everything.
Baseline
Revenue from the last 12 full months: €1,200,000.
Year-on-year trend
Full year +20%, last 3 months +10%.
Seasonality and working days
An index for every month, from 0.75 in July to 1.25 in January.
start a gut-feel plan
Why a “plus 15%” plan drifts off as early as January
The owner of an office supplies shop closes the year at €1,200,000 and puts 15% growth into the 2027 plan. That gives €1,380,000, or €115,000 for every month. The figure looks reasonable, and the problem starts with the first monthly report.
Selling to businesses has a clear shape across the year. In January purchasing departments start spending new budgets, in September offices and schools are back, and July and August are the quietest. With the same annual total, January brings in about €143,750 and July about €86,250.
In a plan like this, July at €86,250 looks like a 25% drop. The result is a nervous cut to the ad budget in a month that is going entirely normally, and in September, when demand returns, campaigns start from zero. January works the other way round: €143,750 gives the impression that the year is going brilliantly, although it is only the season.
The second mistake is less visible: nobody checks how accurate the same percentage would have been a year earlier. If last year “plus 15%” would have missed by half, there is no reason to think it will be right this time.
A good forecast therefore has two features: the shape of the year written into the figure for each month, and a known error, checked on data that has already happened. The three steps below provide the first feature, the backtest provides the second.
step 01–02 level and direction
Steps 1 and 2: the baseline and the year-on-year trend
The starting point is total revenue from the last 12 full months. Full, because an unfinished November would understate the result; twelve, because every month of the year appears in the total exactly once and the seasonal effect cancels out. In the example this is the period from November 2025 to October 2026.
Definitions and formulas
The baseline is the shop’s order revenue from the last 12 full months, excluding cancelled orders.
baseline = €1,200,000 (an average of €100,000 per month)The year-on-year trend is the ratio of the same period in two consecutive years. It is calculated twice: for the whole year and for the last three months.
annual trend = 1,200,000 ÷ 1,000,000 = 1.20 (+20%) 3-month trend = Aug–Oct 2026 ÷ Aug–Oct 2025 = 325,000 ÷ 295,500 ≈ 1.10 (+10%)Two trends tell you whether growth is speeding up or slowing down. The whole year grew by 20%, but the last quarter only by 10%. Putting the full +20% into the forecast would make the plan assume a pace the shop has not had for several months. That is why the base scenario uses the more recent trend: 1,200,000 × 1.10 = €1,320,000 for 2027, an average of €110,000 per month.
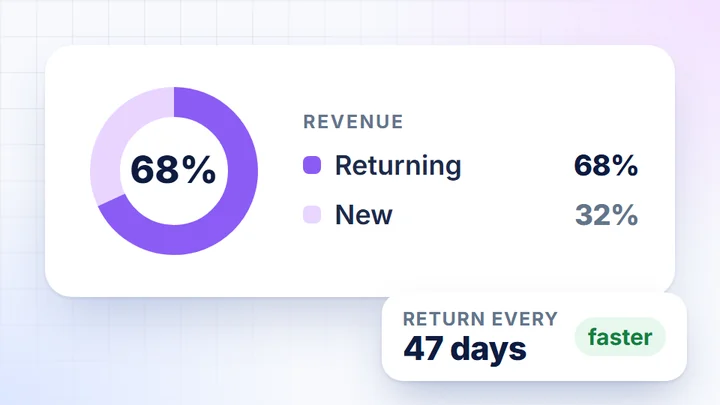
It is worth splitting revenue into returning and new customers straight away. In sales to businesses, returning customers are the regular orders from offices, predictable from month to month. New customers depend on how much the shop spends on advertising and how well it wins new businesses.
| Customers | Nov 2024–Oct 2025 | Nov 2025–Oct 2026 | Change | Share now |
|---|---|---|---|---|
| Returning | €750,000 | €840,000 | +12% | 70% |
| New | €250,000 | €360,000 | +44% | 30% |
| Total | €1,000,000 | €1,200,000 | +20% | 100% |
The table shows where the 20% growth came from: mainly from new customers. If the ad budget is to stay at the same level in 2027, repeating +44% on the new-customer side is unlikely, which is another argument for a more cautious trend in the base scenario.
The forecast is based on the shop’s orders. Revenue reported by ad platforms attributes the same sale to several channels at once and counts conversions in its own way, so their total overstates the result and cannot serve as the baseline.
shape of the year
Step 3: monthly seasonality index and working days
The seasonality index shows how much a given month sells compared with the average month of the year. An index of 1.25 in January means 25% more than the average, an index of 0.75 in July 25% less. A single year can be a fluke, so the index is averaged over at least two years of history.
Formula
month index = month’s revenue ÷ average monthly revenue of the same yearThe indices from two years are averaged for each month separately. The twelve indices add up to 12.00; if they come out differently after averaging, divide all indices by their sum and multiply by 12.
month forecast = average forecast month × index = €110,000 × index| Month | Index | Base forecast 2027 | What is behind the figure |
|---|---|---|---|
| January | 1.25 | €137,500 | new company purchasing budgets |
| February | 1.00 | €110,000 | average month |
| March | 1.10 | €121,000 | quarter close |
| April | 0.95 | €104,500 | before the working-day adjustment |
| May | 0.95 | €104,500 | long weekends |
| June | 0.90 | €99,000 | start of the holiday season |
| July | 0.75 | €82,500 | quietest month |
| August | 0.80 | €88,000 | first back-to-school orders |
| September | 1.20 | €132,000 | offices and schools return |
| October | 1.15 | €126,500 | offices fully staffed |
| November | 1.05 | €115,500 | top-up purchases before year end |
| December | 0.90 | €99,000 | holidays, fewer working days |
| Year | 12.00 | €1,320,000 | base scenario |
In sales to businesses the number of working days matters too, because offices order on working days. An index built from history remembers the calendar of those years, so when a movable holiday changes month, the monthly forecast is adjusted by the ratio of working days.
21working days
22working days
Working-day adjustment
April 2027 = €104,500 × 22 ÷ 21 ≈ €109,4802026 and 2027 both have 253 working days, so the adjustments only shift sales between months. Once they are applied, the remaining months are scaled so that the annual total returns to €1,320,000.
It is worth repeating the same calculation for categories, using order line items. The shop as a whole has an index of 1.20 in September, but school supplies can reach 2.0 or more, while printer paper is almost flat. The purchasing plan needs exactly this category index, because a supplier order is placed for a specific range of products.
check forecast on past data
Backtest: how accurate the forecast would have been a year ago
A backtest means pretending it is a year earlier. You cut the data off at October 2025, build a forecast for November 2025–October 2026 with the same method and compare it with what the shop actually sold. A method that was 30% off a year ago will not become accurate just because you calculate it more carefully now.
In the example, the forecast made in October 2025 came to €1,150,000 (a baseline of €1,000,000 and a +15% trend from the last three months). The shop sold €1,200,000, so the annual error is −4.2%. Breaking it down into three-month blocks shows more than the annual figure alone.
| Period | Forecast | Actual | Forecast error |
|---|---|---|---|
| Nov 2025–Jan 2026 | €306,750 | €312,500 | −1.8% |
| Feb–Apr 2026 | €292,250 | €300,000 | −2.6% |
| May–Jul 2026 | €249,250 | €262,500 | −5.0% |
| Aug–Oct 2026 | €301,750 | €325,000 | −7.2% |
| Whole period | €1,150,000 | €1,200,000 | −4.2% |
The error grows with every quarter: from −1.8% to −7.2%. The forecast understated the result more and more, because in the second half of the year the shop won more new businesses than the trend from autumn 2025 assumed. The method captured the shape of the year well; it did not predict the acceleration.
The test gives two practical figures. The first is an error band of about 7% for distant months, which sets the spread of the scenarios in the next step. The second is the direction: for this shop the method understates more often than it overstates. An error norm like this is built only from your own history, in the same way as your own performance norm instead of other people’s averages.
A forecast without a backtest has unknown accuracy. Stock orders and agency contracts are then signed against a figure that may be 3% off or 30% off, and nobody knows which. A test on last year takes an hour in a spreadsheet and answers that question before anything is signed.
2027 scenarios
Three forecast scenarios for the plan for purchasing and budget
A single figure for the whole year suggests a certainty the forecast does not have. Three scenarios state openly what the backtest showed: the 2027 result may differ from the base scenario by a few percent either way. Each scenario serves a different decision.
€1.44mambitious
€1.32mbase
€1.24mcautious
The 2024/25 and 2025/26 periods are 12 months from November to October.
Cautious · +3%
€1,236,000
an average of €103,000 per month
Stock orders with long lead times, fixed costs, hiring.
Base · +10%
€1,320,000
an average of €110,000 per month
Monthly plan with indices, performance review, day-to-day purchasing.
Ambitious · +20%
€1,440,000
an average of €120,000 per month
A sales target that requires extra new customers and budget.
The cautious scenario sits 6.4% below the base one, within the error band from the backtest. It is a scenario the shop can realistically see without any crisis, which is why commitments that are hard to reverse are based on it: large orders from suppliers with lead times of several weeks, and fixed costs.
The ambitious scenario repeats the full trend of the whole year. Since growth was driven mainly by new customers, this scenario assumes that acquiring them will speed up again. With a MER of 10 over the last 12 months (€120,000 of spend for €1,200,000 of revenue), that means a budget of around €144,000, and only if the extra euros work as well as the existing ones. Whether such a budget fits within profit is decided by a budget calculated from margin and a profit target.
The forecast stays in use all year. Every month, actual results are compared with the base scenario broken down by the indices, not with one twelfth of the annual figure. If after the first quarter the result is tracking closer to the cautious or the ambitious scenario, the purchasing plan and the budget move to that scenario for the following months.
in practice a forecast from shop data
Sales forecasting from shop data in DataOrganizer
Most of the work in a forecast goes into collecting the history; the calculation itself is short. DataOrganizer pulls orders and revenue from the shop day by day, together with order line items (categories) and the split into new and returning customers, and alongside them spend from the ad accounts. The data refreshes every morning with the complete previous day, so the spreadsheet is no longer needed just to collect the figures.
The foundation is the shop’s orders, because they are the only single version of sales that is not split between channels; why the ad platforms and GA4 show different amounts is covered in the guide on why GA4, the ad platform and the shop do not match. On this data the AI assistant calculates the forecast on request, using the same method as in this guide.
The baseline from the last 12 full months is €1,200,000. The annual trend is +20%, but the last three months were only +10% year on year, so the base scenario for 2027 is €1,320,000. Backtest of this method:
| Block | Forecast | Actual | Error |
|---|---|---|---|
| Nov–Jan | €306,750 | €312,500 | −1.8% |
| Feb–Apr | €292,250 | €300,000 | −2.6% |
| May–Jul | €249,250 | €262,500 | −5.0% |
| Aug–Oct | €301,750 | €325,000 | −7.2% |
The method captures the shape of the year well, but in the second half it understated the result because new customers grew (their revenue rose by 44%, returning customers’ by 12%). I suggest a scenario spread of about 7%: cautious €1,236,000, ambitious €1,440,000. January has the highest index (1.25), July the lowest (0.75).
Each question leads to the next: a seasonality index for categories that have to be ordered in advance, a comparison of last month with the base scenario, or total ad spend and monthly MER as context for the budget. Every answer is based on the same shop orders.
The figures in the example are illustrative and refer to a fictional B2B office supplies shop. The method assumes the shop does not make sudden changes to its range, prices or advertising scale; a major change (a new category, launching on a marketplace, a doubled budget) needs a separate scenario.
Key takeaways
A sales forecast is three figures from your own history (baseline, trend and monthly indices) plus an error checked on last year. That error sets the spread of the scenarios, and decisions that are hard to reverse are based on the cautious scenario.
FAQ
Frequently asked questions about shop sales forecasting
How do you forecast sales in an online shop?
Take order revenue from the last 12 full months as the baseline, multiply it by the year-on-year trend (ideally from the last three months) and break it down into months with a seasonality index averaged over at least two years. Then check the same method with a backtest on last year and use its error to set the cautious and ambitious scenarios.
How many months of history does a sales forecast need?
The minimum is 24 months: 12 for the baseline and the previous 12 for the year-on-year trend. The seasonality index and the backtest are more reliable with 36 months, because the index then averages two full years and the test has its own separate history.
What sales forecast error is acceptable?
There is no single standard for all shops; the reference point is the error of the same method in a backtest on your own data. In the example the annual error was 4.2% and 7.2% for distant months, so the scenarios were set about 7% apart. The direction of the error matters more than its size, because a method that consistently understates leads to cautious purchasing and too small a budget.
How do you forecast sales if the shop is less than a year old?
Without a full year you cannot calculate your own seasonality index or year-on-year trend. You can forecast a few months ahead from the average of recent weeks, take the shape of the year provisionally from category demand data and correct it every month until you have built up your own history.
Can a sales forecast be done in Excel?
Yes, all three steps and the backtest are simple sums and divisions, so a spreadsheet with monthly revenue from the shop’s orders is enough. Most of the work goes into regularly collecting that historical data; in DataOrganizer the shop’s orders are pulled daily, and the AI assistant calculates the forecast and the backtest on request.
Summary of the whole guide
Next year's sales forecast in three rules
1. You calculate from shop orders, in full months. The baseline is the last 12 full months, the trend compares the same periods year on year, and the more recent three-month trend shows whether growth is slowing.
2. You break the year down with a seasonality index. Each month gets its own index from at least two years and a working-day adjustment, so July is judged against the July in the forecast.
3. You check the method on last year. The backtest error sets the spread of the three scenarios; in DataOrganizer the order history is ready for this test, and the AI assistant will calculate it on request.
DataOrganizer · sales forecast
Once the shop and ad accounts are connected, the history of orders, categories and new and returning customers is in one place, and the AI assistant uses it to calculate seasonality indices, the trend and the backtest.